監控節點的度量指標:Prometheus 入門
Prometheus 是一套開源的監控系統,常常搭配雲端,監控服務運行狀態。今年 COSCUP 有一位 Speaker 將它用於 End-Devices 的監控,看起來非常有意思。透過這套系統,我們能將各處節點的資訊整合於統一的平台,讓 Operation 監控服務,避免服務中斷導致價值鍊中斷,同時這些數據也能提供給 Developer,作為後續改善的依據。
Prometheus 的基本原理是用 HTTP 定期抓取監控端(target)的資料,target 上會有 exporter,將符合 Prometheus 定義的資訊輸出到 HTTP API,Prometheus 拉取後就能將它顯示於 Dashboard。
Install Prometheus
安裝有兩個方式,可以用 binary 安裝或是用 docker 安裝,為隔離與管理方便,這邊選擇使用 docker 安裝
docker run --name prometheus -d -p 9090:9090 quay.io/prometheus/prometheus 記得將 container port forward 到 host 的 port,讓外面可以使用。
安裝好後,在瀏覽器輸入 Prometheus server 的 IP,應該可以看到 Prometheus 自帶的 GUI,如下
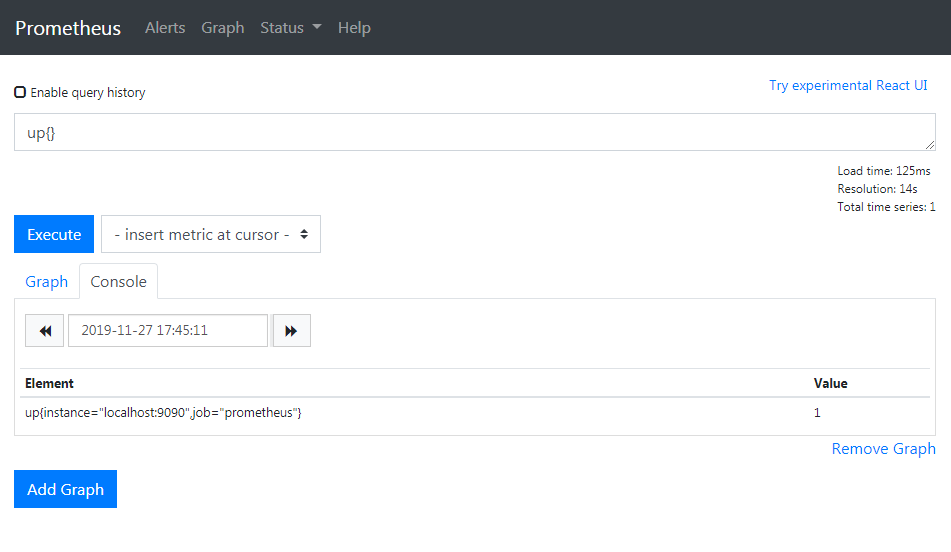
Expression 可以輸入 Prometheus 的查詢 PromQL,Graph 會依照 PromQL 顯示對應的採集資料,這些採集資料稱為 Metric,up 這個 Metric 表示對應的採集實例(instance)狀態,當 up 值為 1,表示 exporter instance 正常運作。
Install Node Exporter
當要抓取不同 target 或更詳細的資料時,會需要一套 exporter 將資料收集起來,方便 Prometheus server 拉取。Node Exporter 這個 Project 就是要做這件事。它是用 Go 語言寫成,沒有相依性問題,直接下載後就能執行
curl -OL [https://github.com/prometheus/node_exporter/releases/download/v0.18.1/node_exporter-0.18.1.linux-amd64.tar.gz](https://github.com/prometheus/node_exporter/releases/download/v0.18.1/node_exporter-0.18.1.linux-amd64.tar.gz)
tar -xzf node_exporter-0.18.1.linux-amd64.tar.gz
cp node_exporter-0.18.1.linux-amd64/node_exporter /usr/local/bin/
node_exporter
下載時請依照自己的作業系統下載對應版本,我們下載 Linux 版後放到安裝目錄,執行
ken@ken-Lenovo-ideapad-330-15ICH:~/git/promethus$ node_exporter

INFO[0000] Starting node_exporter (version=0.18.1, branch=HEAD, revision=3db77732e925c08f675d7404a8c46466b2ece83e)  source="node_exporter.go:156"
INFO[0000] Build context (go=go1.12.5, user=root@b50852a1acba, date=20190604-16:41:18)  source="node_exporter.go:157"
INFO[0000] Enabled collectors:                           source="node_exporter.go:97"
INFO[0000]  - arp                                        source="node_exporter.go:104"
INFO[0000]  - bcache                                     source="node_exporter.go:104"
INFO[0000]  - bonding                                    source="node_exporter.go:104"
...
Node Exporter 預設的 port 是 9100,在瀏覽器上輸入後,可以看到
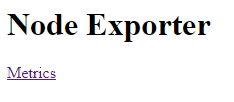
底下的 Metrics 就是採集到的 Metrics,點開來會看到 Node Exporter 有採集的資訊
# HELP go_gc_duration_seconds A summary of the GC invocation durations.
# TYPE go_gc_duration_seconds summary
go_gc_duration_seconds{quantile="0"} 1.4124e-05
go_gc_duration_seconds{quantile="0.25"} 3.1017e-05
go_gc_duration_seconds{quantile="0.5"} 0.000118785
go_gc_duration_seconds{quantile="0.75"} 0.000144924
go_gc_duration_seconds{quantile="1"} 0.000173711
go_gc_duration_seconds_sum 0.000581784
go_gc_duration_seconds_count 6
# HELP go_goroutines Number of goroutines that currently exist.
# TYPE go_goroutines gauge
go_goroutines 7
# HELP go_info Information about the Go environment.
# TYPE go_info gauge
go_info{version="go1.12.5"} 1
# HELP go_memstats_alloc_bytes Number of bytes allocated and still in use.
# TYPE go_memstats_alloc_bytes gauge
go_memstats_alloc_bytes 1.942816e+06
...
Install Node Exporter
要將新增的 instance 告知 Prometheus server,讓 server 去拉取,就要去修改 server 的 config 檔,因為我們前面是用 docker 來執行,因此要先進到 container 內。其實更好的辦法應該是讓 container 跟外部的 config 檔同步,但我們先關注在 Prometheus 的操作上
docker exec -it prometheus sh打開 config file
cd /etc/prometheus/
vi prometheus.yml
在最下面加入新的 Job
# A scrape configuration containing exactly one endpoint to scrape:
# Here it's Prometheus itself.
scrape_configs:
# The job name is added as a label `job=<job_name>` to any timeseries scraped from this config.
- job_name: 'prometheus'
# metrics_path defaults to '/metrics'
# scheme defaults to 'http'.
static_configs:
- targets: ['localhost:9090']
- job_name: 'node'
static_configs:
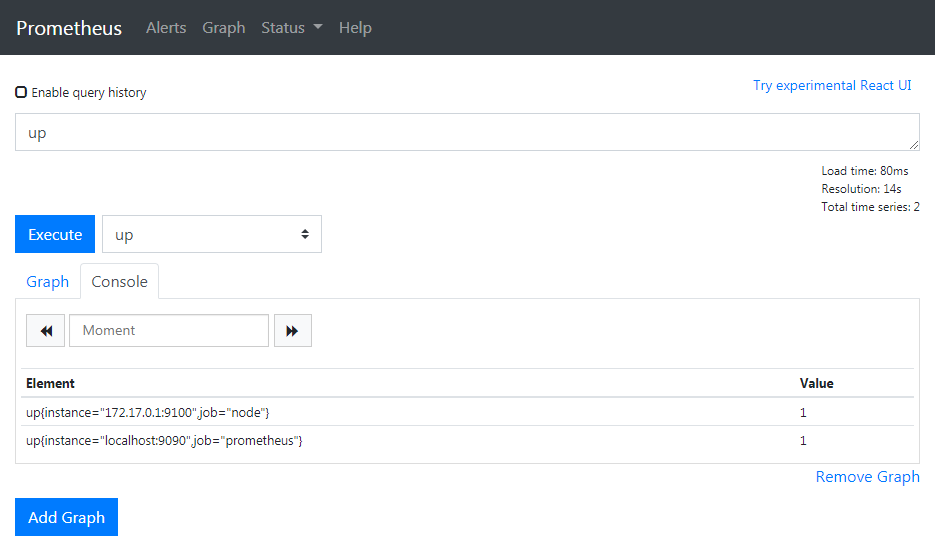
- targets: ['172.17.0.1:9100']在 Prometheus 的術語中,Job 表示一組任務,任務中可能包括對好幾個 instance 的採集。上面新增一組 Job 稱為 node,對 172.17.0.1:9100 這個 instance 進行採集。
設定完成後重啟 promethus
docker container restart prometheus打開瀏覽器的 UI,可以看到出現新的 instance
Query CPU Usage
假設我們要查詢 instance 的 CPU 使用率,可以怎麼做?我們可以由 Node Exporter 的說明中,看到 node_cpu_seconds_total 這項 metric 是 cpu 花費在特定模式的秒數。
於是使用 PromQL 的內建函數 irate(v[time]),來取得數據的在時間區段的瞬間增長率,由於 CPU 在時間區段使用的時間秒數就是 CPU 的使用率,如此一來,就能取得使用率數值。
最後,使用 PromQL 的聚合操作 avg,來將各 CPU 的數值合併,取其平均,聚合的規則是以各 instance 為聚合單位。
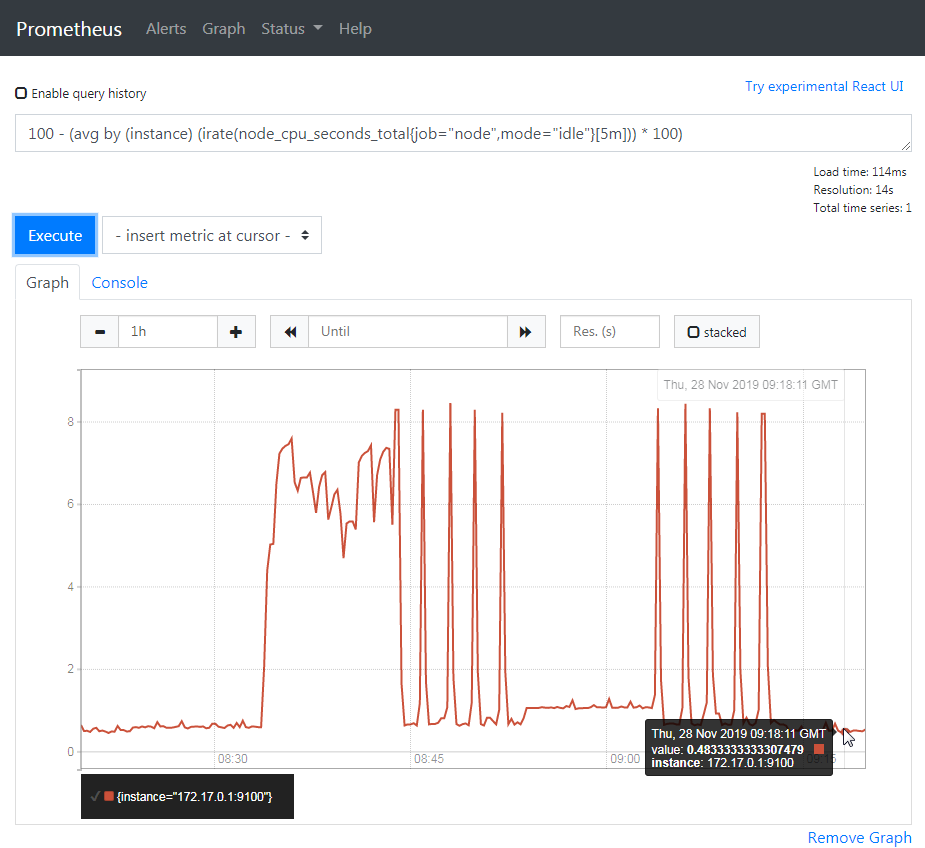
結合所有查詢式如下
100 - (avg by (instance) (irate(node_cpu_seconds_total{job="node",mode="idle"}[5m])) * 100)job 跟 mode 是 metric 的 label,扣掉 idle 所佔的使用率後,剩下的使用率就是 CPU 使用率了,按下執行後,Graph 就跑出來啦
Monitor PRi
確認主機的資訊能拉取後,如法炮製到 RPi 上,安裝 Node Exporter,Model B 的架構是 armv6
pi@raspberrypi:~/prometheus $ wget [https://github.com/prometheus/node_exporter/releases/download/v0.18.1/node_exporter-0.18.1.linux](https://github.com/prometheus/node_exporter/releases/download/v0.18.1/node_exporter-0.18.1.linux)
-armv6.tar.gz
pi@raspberrypi:~/prometheus $ tar -zxvf node_exporter-0.18.1.linux-armv6.tar.gz
pi@raspberrypi:~/prometheus $ cd node_exporter-0.18.1.linux-armv6/
pi@raspberrypi:~/prometheus/node_exporter-0.18.1.linux-armv6 $ ./node_exporter
修改 prometheus.yml,加入新的 instance
# A scrape configuration containing exactly one endpoint to scrape:
# Here it's Prometheus itself.
scrape_configs:
  # The job name is added as a label `job=<job_name>` to any timeseries scraped from this config.
  - job_name: 'prometheus'
    # metrics_path defaults to '/metrics'
    # scheme defaults to 'http'.
    static_configs:
      - targets: ['localhost:9090']
  - job_name: 'node'
    static_configs:
      - targets: ['172.17.0.1:9100', '192.168.5.10:9100']
刷新頁面,觀察結果
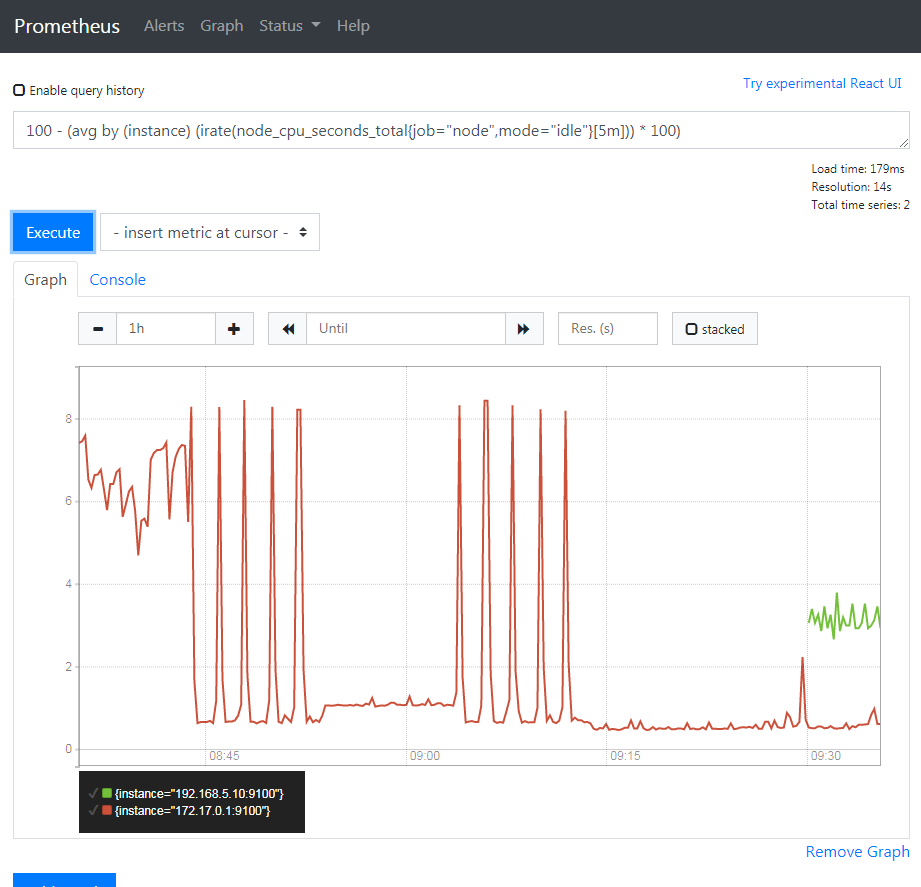
RPi 的 CPU 使用率快樂抖動中。
小結
上張 Prometheus 的架構圖
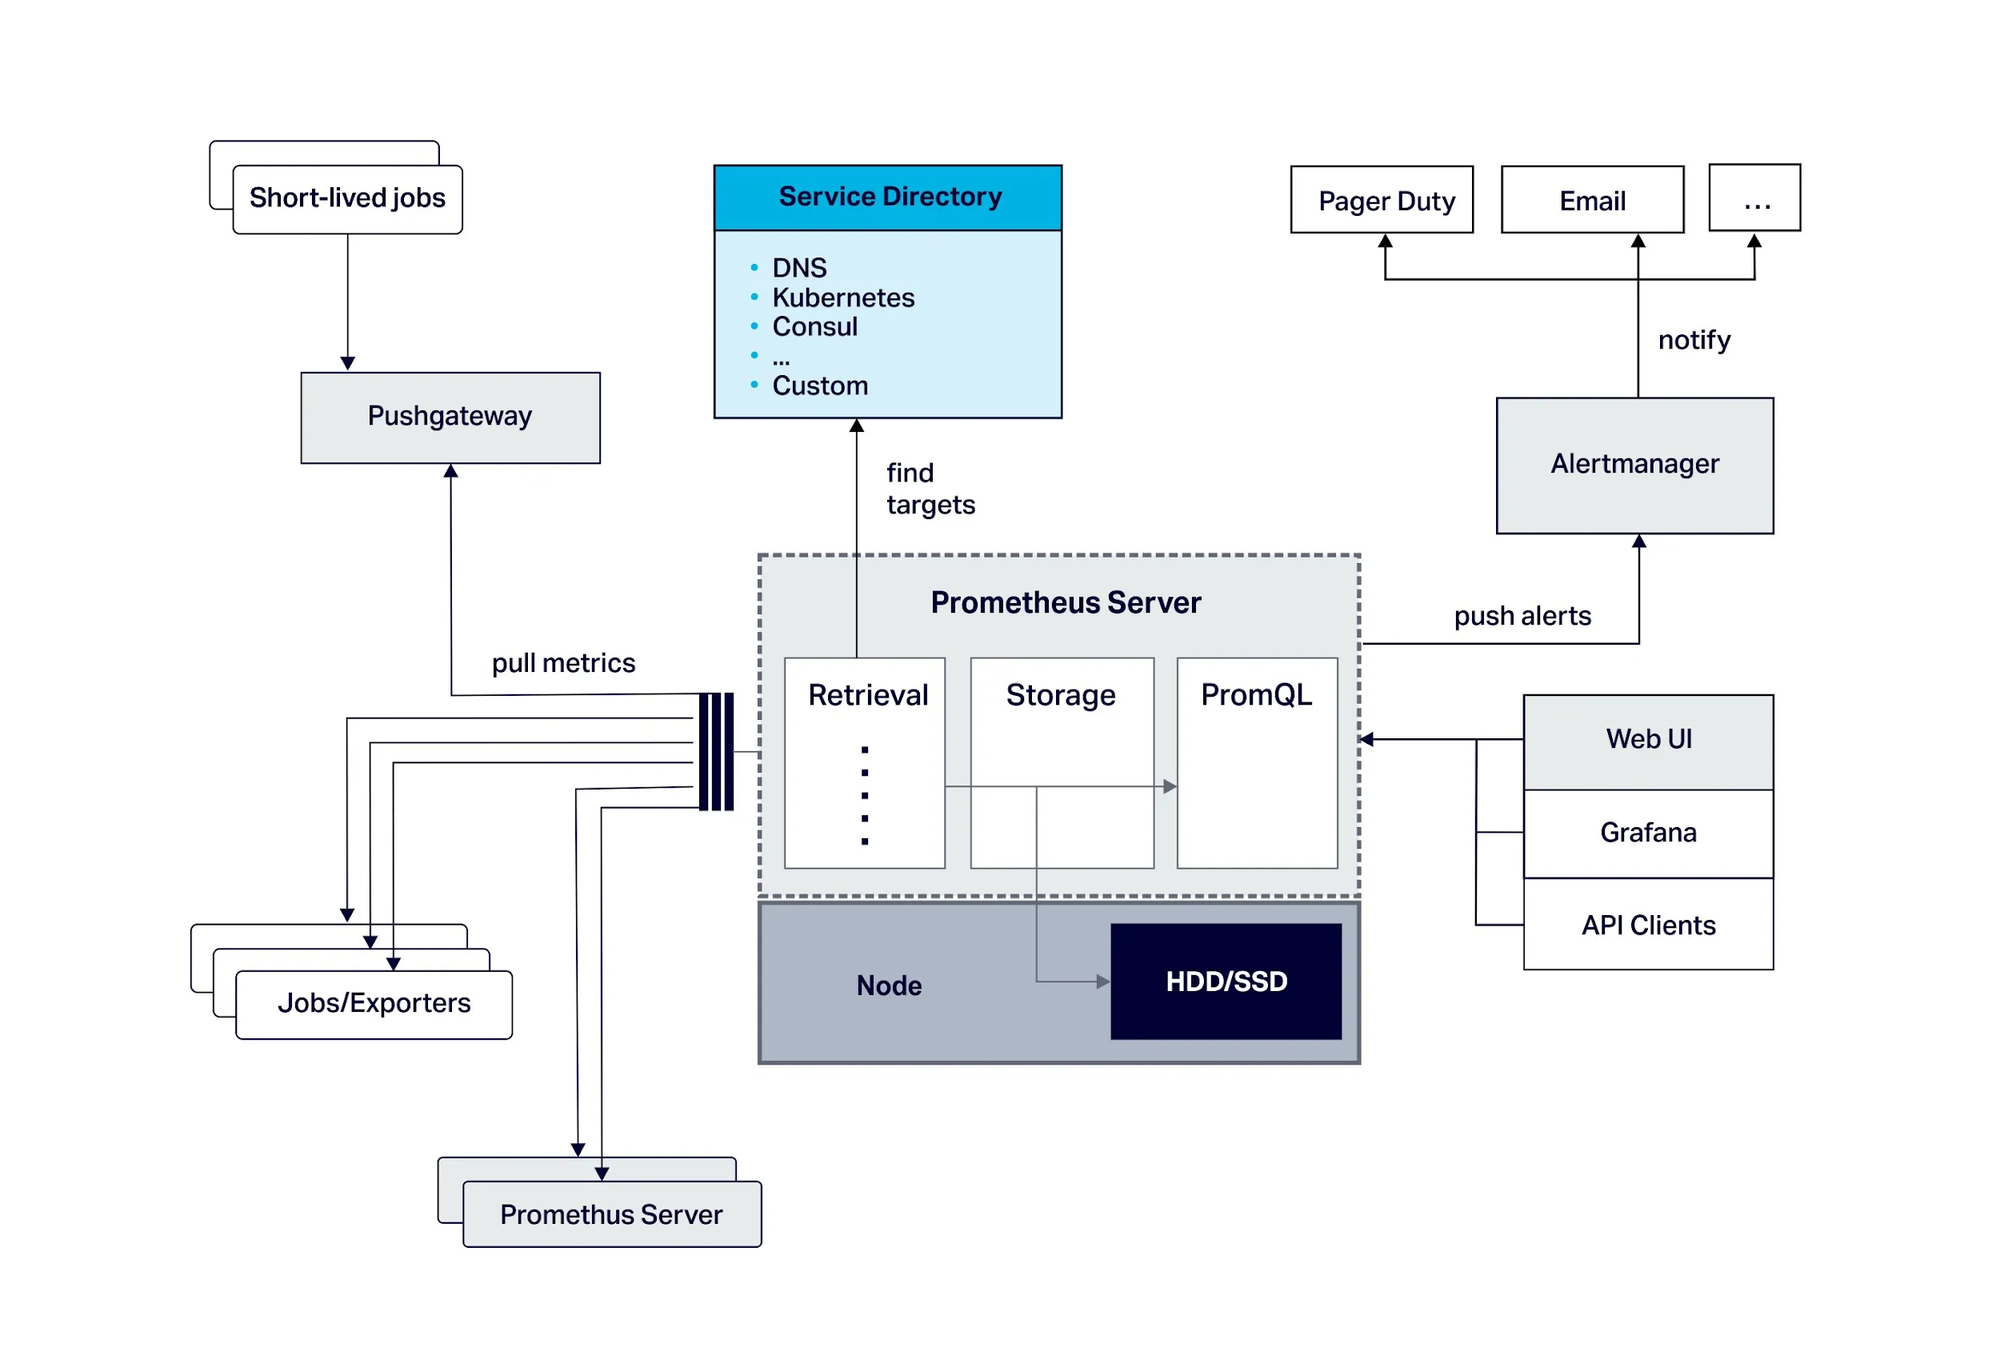
Prometheus 整個生態系有許多組件,在這個 Demo 中,用到的是 Prometheus Server、WebUI、Exporter 等架構圖下半部分,其他不同組件也有各自的用途。使用 Prometheus,我們能夠 Monitor 服務運行的狀況,也可以用它來通知異常(在今年的 COSCUP 中,Line 的 Speaker 就用它來觀察會議室中的活動人數,免得有人借了會議室卻不使用)。
如果你還在尋找維運工具,不妨試試看。