在 GitLab 顯示測試覆蓋率:以 Go 為例

對現代開發者來講,單元測試已經不是可選,而是必備了。單元測試能保護程式碼,讓錯誤提早現形,也能讓重構時更安心。通常我們在評估單元測試的執行狀況時,會用 coverage 當成其中一項指標。當然,coverage 還是會有一些使用的場合跟侷限,當談到專案落地,可能大家會想知道的是,coverage 該怎麼使用,才能幫助到專案?
開發、審查、回顧
我們先來看看什麼時候會需要知道 coverage?通常依照團隊的工作流程,將它分為三個階段:開發、審查、回顧。每個階段關注的場景會略有不同。
一個一個講。對開發中情形,開發者想知道的是剛寫完的邏輯是否能正常運行,有沒有對應的測試,覆蓋範圍是否已經足夠,如果還有條件分支沒覆蓋到的話,是哪裡?是不是每個錯誤都有處理了。這時最需要的是,codebase 要能 highlight 剛剛講的資訊,幫助開發者一眼掌握。
當開發完成,feature branch 被提交到原始碼管理系統,例如 GitLab,會需要一名 Reviewer 來負責審查。審查過程中,Reviewer 會看 coverage 來評估代碼品質,像是提交版本的覆蓋率是多少?跟前一版本比較起來,覆蓋率有沒有下降?哪些新寫的代碼是沒有覆蓋到的?
而當專案進展到一個 Milestone,專案負責人想要回顧專案執行狀況,以安排接下來的計畫,這時會需要先蒐集一些資訊。通常 codebase 覆蓋率可能會被當成某種品質指標,用來放進關鍵結果中。
解題思路
當我們釐清需求與場景後,接著可以來想解法了。
開發中的場景很單純,因為現在的 Editor 或 IDE 幾乎都有提供相關的插件,讓開發者能自行驗證,以 VSCode 來說,如果你有安裝官方的 Go 語言 Extension,它就能支援單元測試。如果你沒有,那也不要緊,因為 Go 已經幫你將測試工具整合進 CLI,只要自行呼叫就可以了。
~/git/ken/test-server: go test -coverprofile=c.out ./...
? test-server [no test files]
? test-server/cmd/server [no test files]
? test-server/internal/config [no test files]
? test-server/internal/handler [no test files]
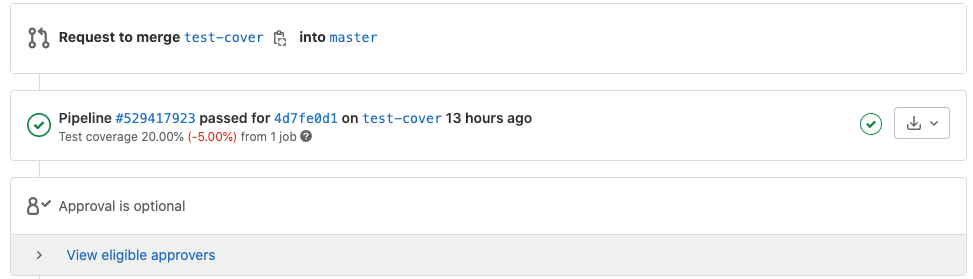
ok test-server/internal/service 0.437s coverage: 88.2% of statements審查中的場景比較麻煩,畢竟各家版控服務都不相同,需要在意的點也不同,以 GitLab 為例,Reviewer 需要知道的是 MR 時,整體的 coverage 有多少?哪些代碼有覆蓋哪些沒有?GitLab 文件中有兩個功能看起來不錯,第一個是 Merge request test coverage results,能抓出 coverage 的數值
If you use test coverage in your code, you can use a regular expression to find coverage results in the job log. You can then include these results in the merge request in GitLab.
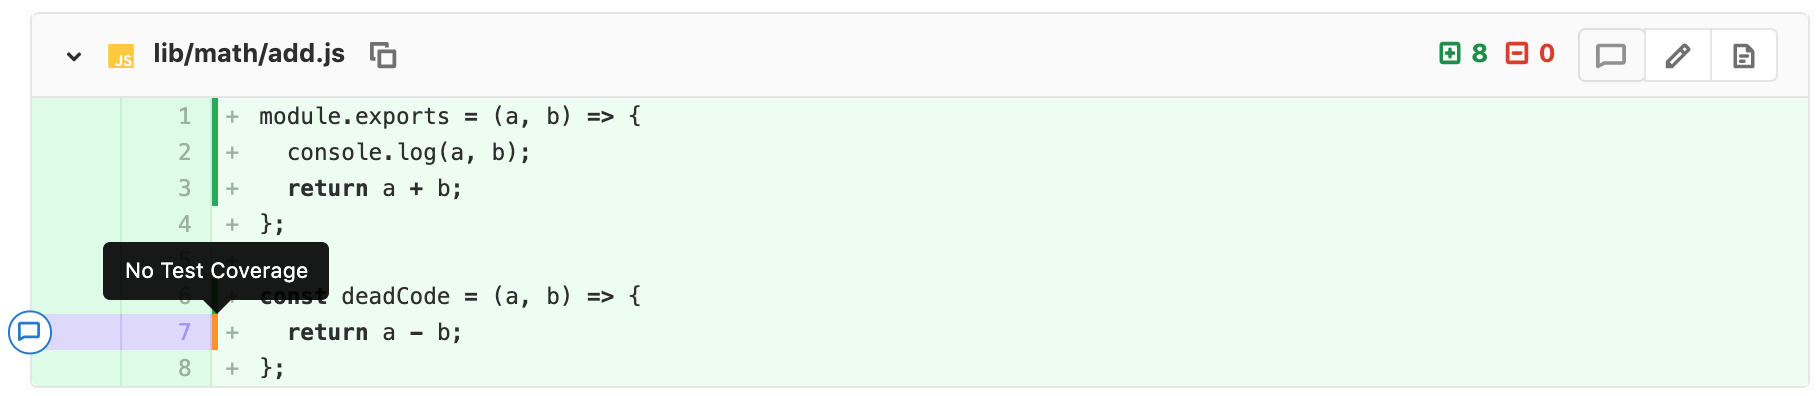
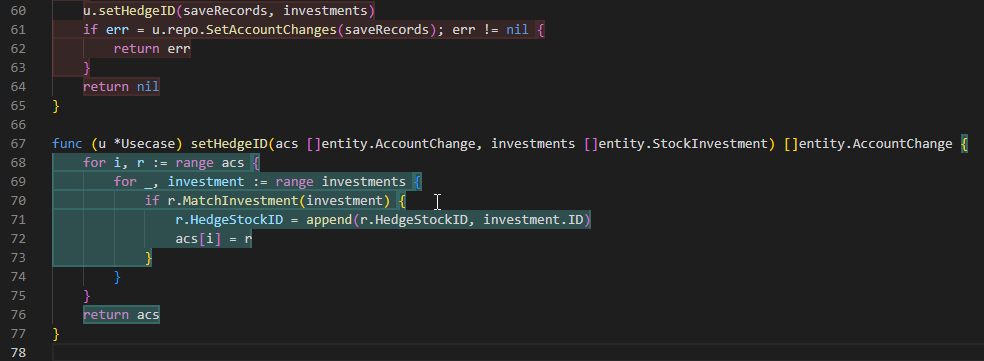
第二個是 Test coverage visualization,能在 MR 的 diff view 中呈現覆蓋的程式碼
With the help of GitLab CI/CD, you can collect the test coverage information of your favorite testing or coverage-analysis tool, and visualize this information inside the file diff view of your merge requests (MRs). This will allow you to see which lines are covered by tests, and which lines still require coverage, before the MR is merged.
效果類似這樣
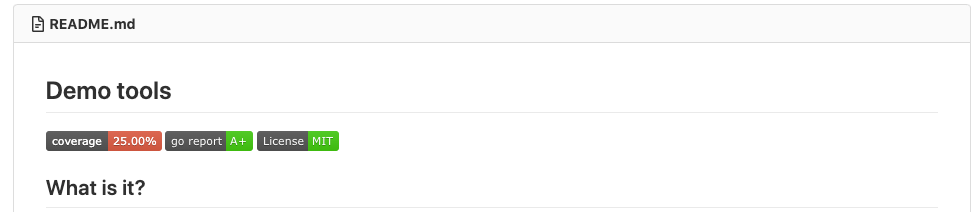
至於當我們需要回顧時,最好在專案首頁有一行類似 Metric 的字說明現況,即使沒接觸專案的人,也能知道專案的健康度。這個很適合用 Badge 來展現,通常 Badge 會貼在 Readme 上,而 Readme 會被 GitLab 自動放在專案首頁
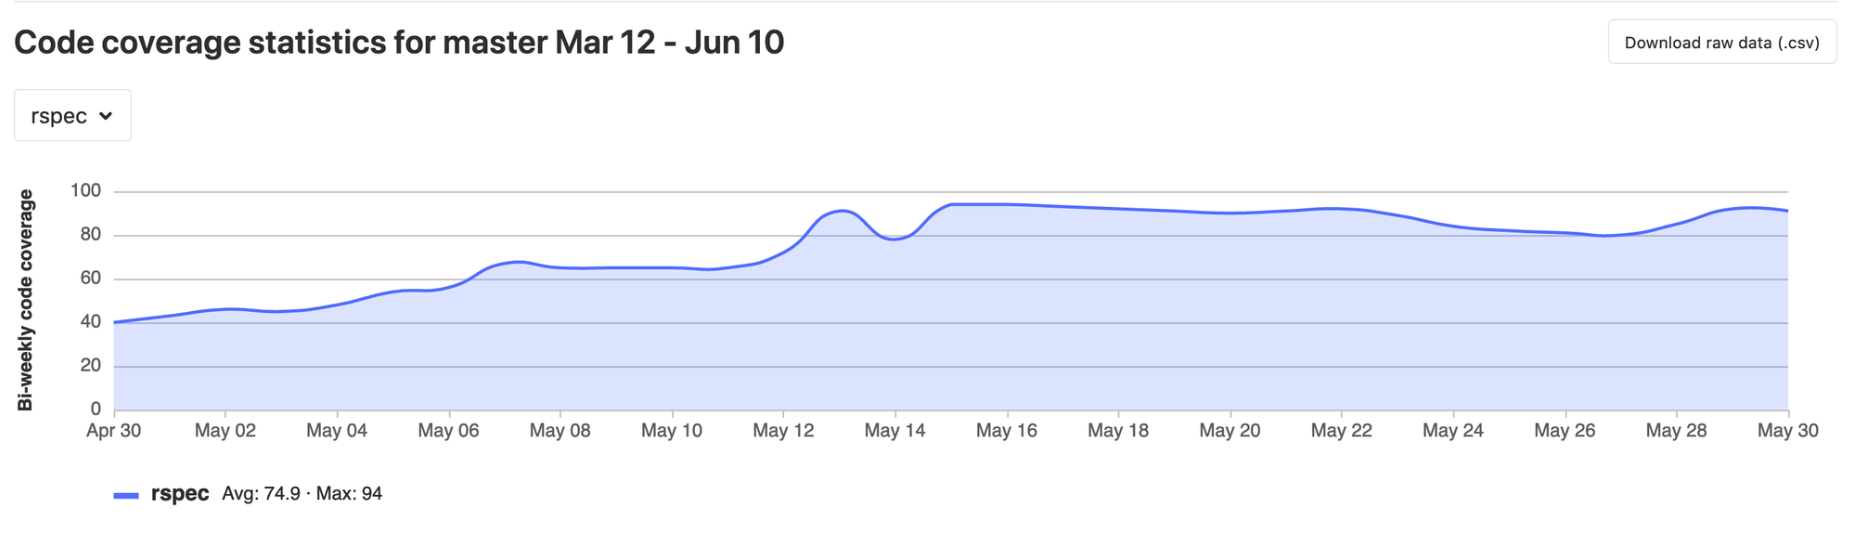
當然,如果可以,我們也會想分析專案的趨勢,是不是朝向健康的方向走,如果沒有,也許透過一些改善方式,例如講解 unit test 的概念、使用手法等等,來幫助團隊往前走。這時候 GitLab 的 Analytic 就很好用,可以用來觀察長期趨勢。
開始動手
方法擬定後,開始來動手吧。
假設你的 IDE 是 VSCode,可以到 Extension 安裝 Go 語言的延伸套件,然後在 test file 上應該能看到 run package tests,執行後專案內就會 highlight coverage,有覆蓋的部分是綠底,沒覆蓋則是紅底。
也可以在 Output Tab 看到呼叫指令
Running tool: C:\Users\ken\.g\go\bin\go.exe test -timeout 30s -coverprofile=C:\Users\ken\AppData\Local\Temp\vscode-goK1REdF\go-code-cover ken-test/pkg/app/usecase

ok      ken-test/pkg/app/usecase    0.523s  coverage: 14.6% of statements
原理是用 UI 的方式調用底層的 go test,產生 coverprofile 後,再將它餵給 VSCode。
VSCode 怎麼知道 test 時經過哪些路徑呢?這裡的重點是 coverprofile,內容類似
mode: set
app-test/internal/app/usecase.go:12.92,14.16 2 0
app-test/internal/app/usecase.go:17.2,17.25 1 0
app-test/internal/app/usecase.go:14.16,16.3 1 0
app-test/internal/app/usecase.go:20.102,21.32 1 0
Go 用來產生 coverprofile 的命令是
go test -coverprofile=coverage.txt ./...同理可證,如果 VSCode 吃 coverprofile 能 highlight coverage,只要餵 GitLab 同樣的檔案,GitLab 應該能做到同樣的效果。不過事情沒這麼美好。查詢說明文件,發現
For the coverage analysis to work, you have to provide a properly formatted Cobertura XML report to artifacts:reports:coverage_report.
意思是,原生的 coverprofile 格式,GitLab 是不接受的。需要將它轉換成 Cobertura format 並提供給 GitLab。
Cobertura 是什麼東西?參考 GitHub 的專案
Cobertura is a free Java code coverage reporting tool. It is based on jcoverage 1.0.5. See the Cobertura web page and wiki for more details.
Cobertura 是西班牙語 coverage 的意思,它是一套 Java 的 coverage 報告工具。Jenkins 使用它產出的報告來呈現 coverage,也因為 Jenkins 的使用者眾多,支援的場景比較齊全,GitLab 為了讓專案無痛轉換,也支援了 Cobertura 的格式,它的長相是這樣
<?xml version="1.0" encoding="UTF-8"?>
<!DOCTYPE coverage SYSTEM "[http://cobertura.sourceforge.net/xml/coverage-04.dtd](http://cobertura.sourceforge.net/xml/coverage-04.dtd)">
<coverage line-rate="0.21586345" branch-rate="0" version="" timestamp="1664528908194" lines-covered="215" lines-valid="996" branches-covered="0" branches-valid="0" complexity="0">
  <sources>
    <source>D:\git\ken\ken-test</source>
  </sources>
  <packages>
    <package name="ken-test/pkg/app/repository" line-rate="0.30869564" branch-rate="0" complexity="0">
      <classes>
        <class name="Sdk" filename="pkg/app/repository/repo_data.go" line-rate="0.9423077" branch-rate="0" complexity="0">
          <methods>
            <method name="GetDataPage" signature="" line-rate="0.9423077" branch-rate="0" complexity="0">
              <lines>
                <line number="14" hits="1"></line>
                <line number="15" hits="1"></line>
...
可以看出內容跟 Go 原生的 coverprofile 接近,只是改成用 XML 的格式。
要將 coverprofile 轉成 Cobertura,GitHub 有現成的工具
go install github.com/boumenot/gocover-cobertura@latest
gocover-cobertura < coverage.txt > coverage.xml
轉換後,只要將這個檔案餵給 GitLab 就可以了。當然,我們希望這些事情都可以串進 CI Pipeline 自動完成,從 GitLab 的流程來思考的話,我們會需要個 test stage,該 stage 下有個 job,用來產出 coverage.xml,並將產出物提交給 GitLab Server,而 GitLab 自動根據這份文檔,顯示對應的資訊。
這些邏輯變成 gitlab-ci.yml 後,會是
stage:
  - test

code_coverage_report:
  stage: test
  script:
    - go test ./... -coverprofile=coverage.txt -covermode count
    - go install github.com/boumenot/gocover-cobertura@latest
    - $GOPATH/bin/gocover-cobertura < coverage.txt > coverage.xml
  artifacts:
    reports:
      cobertura: coverage.xml
關於 Badge 呢,如法炮製,加入一個 job 來處理,這個就比較單純了,因為 Badge 是由 GitLab Server 自己產生,我們只要更新它對應的變數就好,也就是只是要抓一個數字而已,它抓數字的方式也很有意思,是用 console output 跟 regexp 來抓,想想也挺合理,它不在乎你的輸出格式是什麼,也不在意怎麼 Parse,只要告訴它要抓的值就可以,這樣的設計為不同語言都提供了彈性。
coverage:
  stage: test
  script:
  - go tool cover -func=coverage.txt
  coverage: '/total:\s+\(statements\)\s+(\d+.\d+\%)/'
當然最後不要忘記,Readme 中要加上 Badge
[](<https://gitlab.com/ken00535/demo-tools/commits/master>)
結語
簡單說明由需求到落地的思考過程。這套思路是用資訊架構三本柱的「場景」「使用者」「內容」來分的,嘗試先定義出場景跟使用者關心的事,再來補齊相關的內容。不得不說確實好用,當場景拆解出來後,要求的資訊也跟著水落石出。例如我原本沒想過用 Cobertura 的格式,可是當知道需要顯示 Line Hit 時,就開始研究其他家的做法,也開始好奇 Go 的 Built-in Tool 有沒有支援類似的場景。
我猜 coverage 應該還有些不同的應用,像是不單判斷有沒有覆蓋,還更進一步用 heatmap 來呈現;或者是將 coverage trend 跟 issues 的發生頻率做比對,證明 unit test 對品質的有效性。希望大家看完這篇後,也能找到適合自己團隊的用法。