Prometheus 是一套開源的監控系統,常常搭配雲端,監控服務運行狀態。今年 COSCUP 有一位 Speaker 將它用於 End-Devices 的監控,看起來非常有意思。透過這套系統,我們能將各處節點的資訊整合於統一的平台,讓 Operation 監控服務,避免服務中斷導致價值鍊中斷,同時這些數據也能提供給 Developer,作為後續改善的依據。
Prometheus 的基本原理是用 HTTP 定期抓取監控端(target)的資料,target 上會有 exporter,將符合 Prometheus 定義的資訊輸出到 HTTP API,Prometheus 拉取後就能將它顯示於 Dashboard。
# Install Prometheus
安裝有兩個方式,可以用 binary 安裝或是用 docker 安裝,為隔離與管理方便,這邊選擇使用 docker 安裝
docker run --name prometheus -d -p 9090:9090 quay.io/prometheus/prometheus 記得將 container port forward 到 host 的 port,讓外面可以使用。
安裝好後,在瀏覽器輸入 Prometheus server 的 IP,應該可以看到 Prometheus 自帶的 GUI,如下
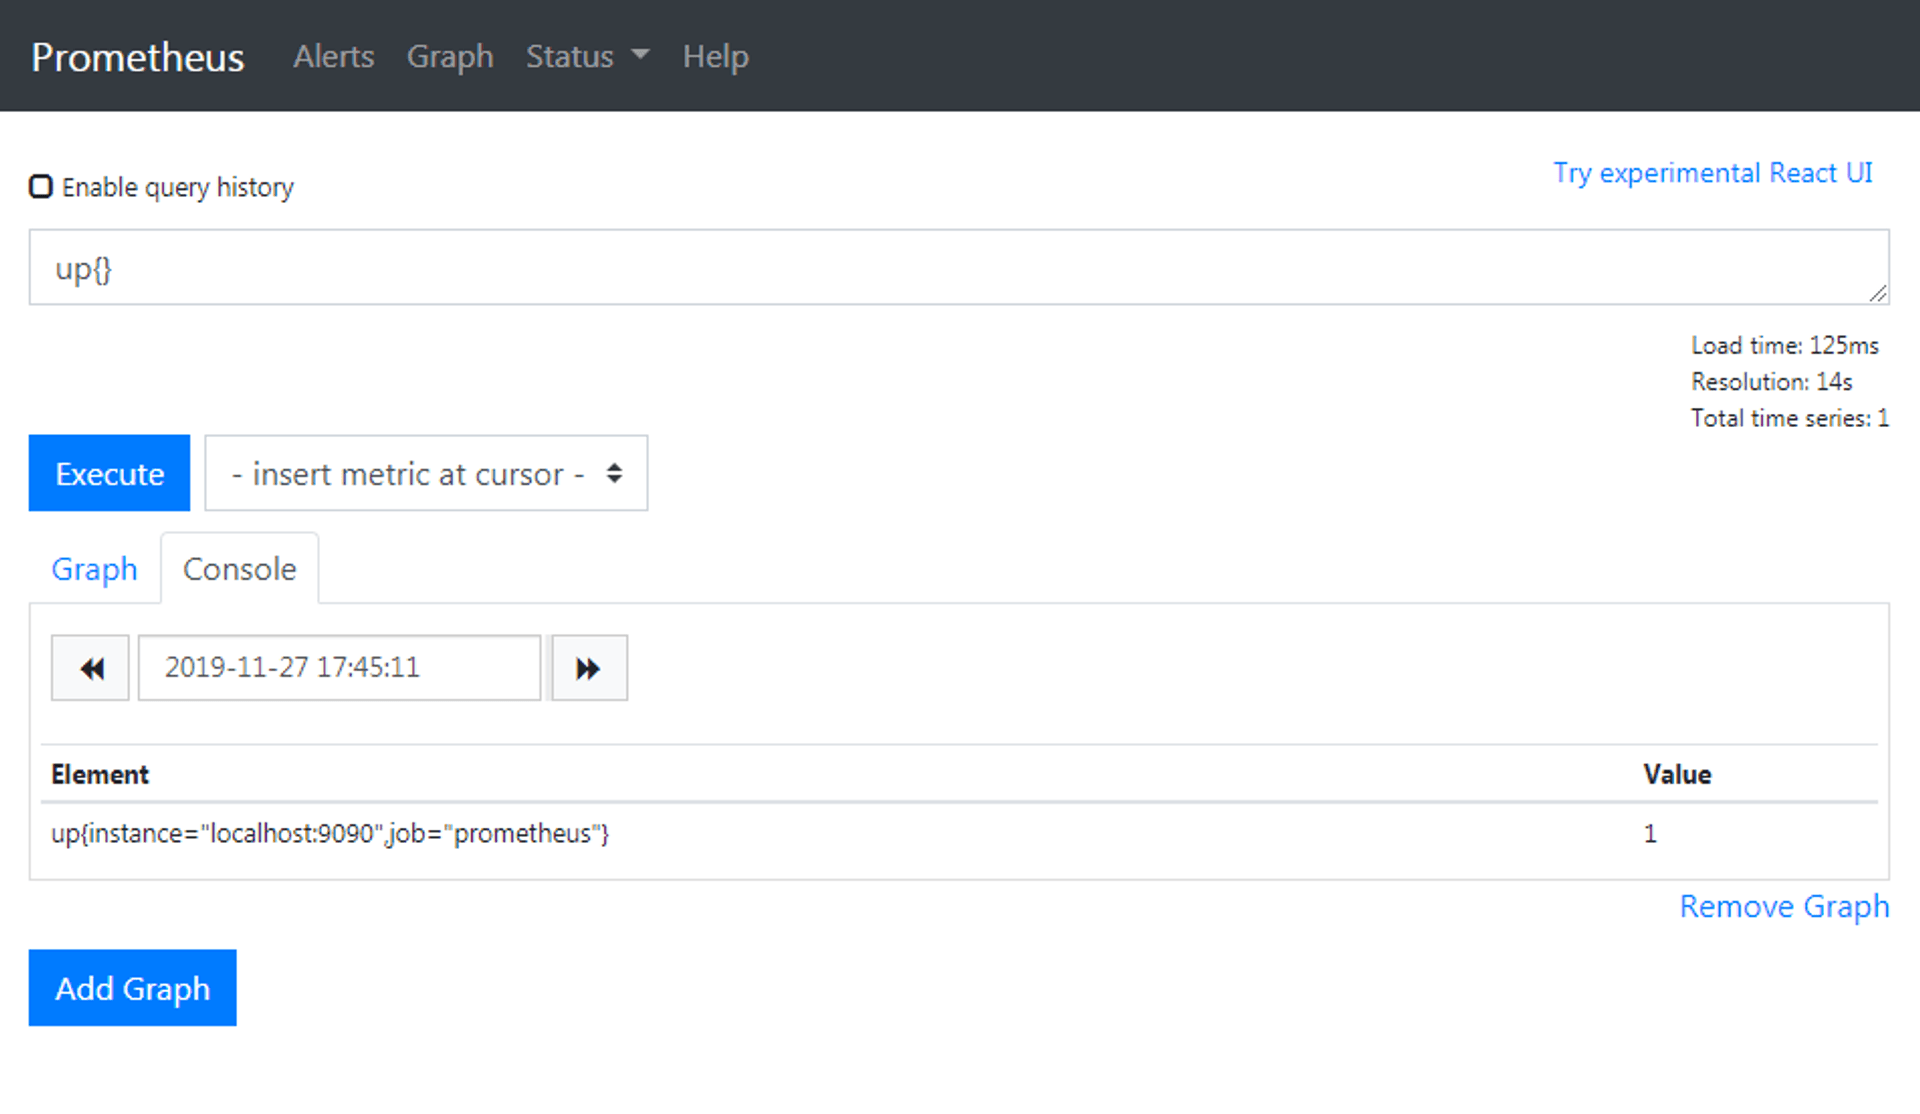
Expression 可以輸入 Prometheus 的查詢 PromQL,Graph 會依照 PromQL 顯示對應的採集資料,這些採集資料稱為 Metric,up 這個 Metric 表示對應的採集實例(instance)狀態,當 up 值為 1,表示 exporter instance 正常運作。
# Install Node Exporter
當要抓取不同 target 或更詳細的資料時,會需要一套 exporter 將資料收集起來,方便 Prometheus server 拉取。Node Exporter 這個 Project 就是要做這件事。它是用 Go 語言寫成,沒有相依性問題,直接下載後就能執行
curl -OL [https://github.com/prometheus/node_exporter/releases/download/v0.18.1/node_exporter-0.18.1.linux-amd64.tar.gz](https://github.com/prometheus/node_exporter/releases/download/v0.18.1/node_exporter-0.18.1.linux-amd64.tar.gz)
tar -xzf node_exporter-0.18.1.linux-amd64.tar.gz
cp node_exporter-0.18.1.linux-amd64/node_exporter /usr/local/bin/
node_exporter
下載時請依照自己的作業系統下載對應版本,我們下載 Linux 版後放到安裝目錄,執行
ken@ken-Lenovo-ideapad-330-15ICH:~/git/promethus$ node_exporter

INFO[0000] Starting node_exporter (version=0.18.1, branch=HEAD, revision=3db77732e925c08f675d7404a8c46466b2ece83e)  source="node_exporter.go:156"
INFO[0000] Build context (go=go1.12.5, user=root@b50852a1acba, date=20190604-16:41:18)  source="node_exporter.go:157"
INFO[0000] Enabled collectors:                           source="node_exporter.go:97"
INFO[0000]  - arp                                        source="node_exporter.go:104"
INFO[0000]  - bcache                                     source="node_exporter.go:104"
INFO[0000]  - bonding                                    source="node_exporter.go:104"
...
Node Exporter 預設的 port 是 9100,在瀏覽器上輸入後,可以看到
底下的 Metrics 就是採集到的 Metrics,點開來會看到 Node Exporter 有採集的資訊
# HELP go_gc_duration_seconds A summary of the GC invocation durations.
# TYPE go_gc_duration_seconds summary
go_gc_duration_seconds{quantile="0"} 1.4124e-05
go_gc_duration_seconds{quantile="0.25"} 3.1017e-05
go_gc_duration_seconds{quantile="0.5"} 0.000118785
go_gc_duration_seconds{quantile="0.75"} 0.000144924
go_gc_duration_seconds{quantile="1"} 0.000173711
go_gc_duration_seconds_sum 0.000581784
go_gc_duration_seconds_count 6
# HELP go_goroutines Number of goroutines that currently exist.
# TYPE go_goroutines gauge
go_goroutines 7
# HELP go_info Information about the Go environment.
# TYPE go_info gauge
go_info{version="go1.12.5"} 1
# HELP go_memstats_alloc_bytes Number of bytes allocated and still in use.
# TYPE go_memstats_alloc_bytes gauge
go_memstats_alloc_bytes 1.942816e+06
...
# Install Node Exporter
要將新增的 instance 告知 Prometheus server,讓 server 去拉取,就要去修改 server 的 config 檔,因為我們前面是用 docker 來執行,因此要先進到 container 內。其實更好的辦法應該是讓 container 跟外部的 config 檔同步,但我們先關注在 Prometheus 的操作上
docker exec -it prometheus sh打開 config file
cd /etc/prometheus/
vi prometheus.yml
在最下面加入新的 Job
# A scrape configuration containing exactly one endpoint to scrape:
# Here it's Prometheus itself.
scrape_configs:
# The job name is added as a label `job=<job_name>` to any timeseries scraped from this config.
- job_name: 'prometheus'
# metrics_path defaults to '/metrics'
# scheme defaults to 'http'.
static_configs:
- targets: ['localhost:9090']
- job_name: 'node'
static_configs:
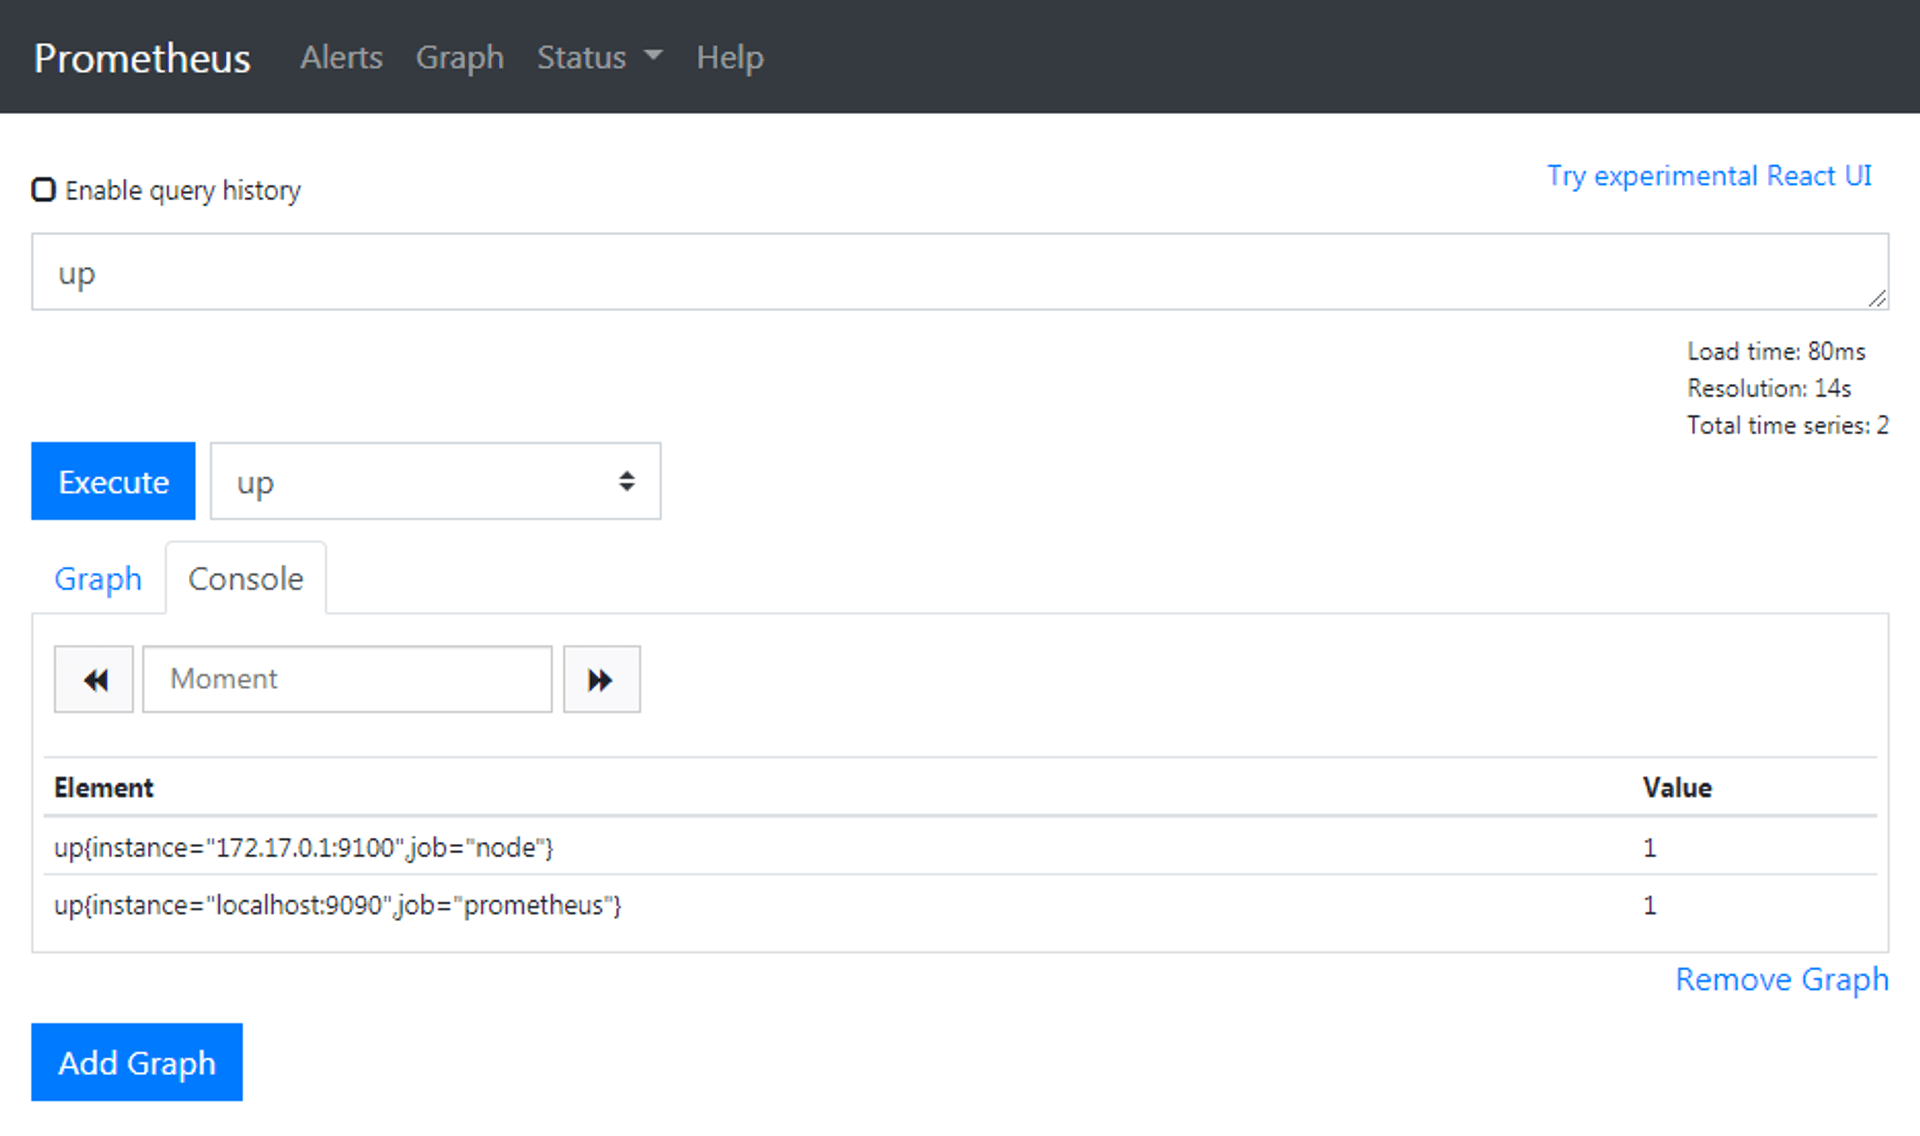
- targets: ['172.17.0.1:9100']在 Prometheus 的術語中,Job 表示一組任務,任務中可能包括對好幾個 instance 的採集。上面新增一組 Job 稱為 node,對 172.17.0.1:9100 這個 instance 進行採集。
設定完成後重啟 promethus
docker container restart prometheus打開瀏覽器的 UI,可以看到出現新的 instance
# Query CPU Usage
假設我們要查詢 instance 的 CPU 使用率,可以怎麼做?我們可以由 Node Exporter 的說明中,看到 node_cpu_seconds_total 這項 metric 是 cpu 花費在特定模式的秒數。
於是使用 PromQL 的內建函數 irate(v[time]),來取得數據的在時間區段的瞬間增長率,由於 CPU 在時間區段使用的時間秒數就是 CPU 的使用率,如此一來,就能取得使用率數值。
最後,使用 PromQL 的聚合操作 avg,來將各 CPU 的數值合併,取其平均,聚合的規則是以各 instance 為聚合單位。
結合所有查詢式如下
100 - (avg by (instance) (irate(node_cpu_seconds_total{job="node",mode="idle"}[5m])) * 100)job 跟 mode 是 metric 的 label,扣掉 idle 所佔的使用率後,剩下的使用率就是 CPU 使用率了,按下執行後,Graph 就跑出來啦

# Monitor PRi
確認主機的資訊能拉取後,如法炮製到 RPi 上,安裝 Node Exporter,Model B 的架構是 armv6
pi@raspberrypi:~/prometheus $ wget [https://github.com/prometheus/node_exporter/releases/download/v0.18.1/node_exporter-0.18.1.linux](https://github.com/prometheus/node_exporter/releases/download/v0.18.1/node_exporter-0.18.1.linux)
-armv6.tar.gz
pi@raspberrypi:~/prometheus $ tar -zxvf node_exporter-0.18.1.linux-armv6.tar.gz
pi@raspberrypi:~/prometheus $ cd node_exporter-0.18.1.linux-armv6/
pi@raspberrypi:~/prometheus/node_exporter-0.18.1.linux-armv6 $ ./node_exporter
修改 prometheus.yml,加入新的 instance
# A scrape configuration containing exactly one endpoint to scrape:
# Here it's Prometheus itself.
scrape_configs:
  # The job name is added as a label `job=<job_name>` to any timeseries scraped from this config.
  - job_name: 'prometheus'
    # metrics_path defaults to '/metrics'
    # scheme defaults to 'http'.
    static_configs:
      - targets: ['localhost:9090']
  - job_name: 'node'
    static_configs:
      - targets: ['172.17.0.1:9100', '192.168.5.10:9100']
刷新頁面,觀察結果
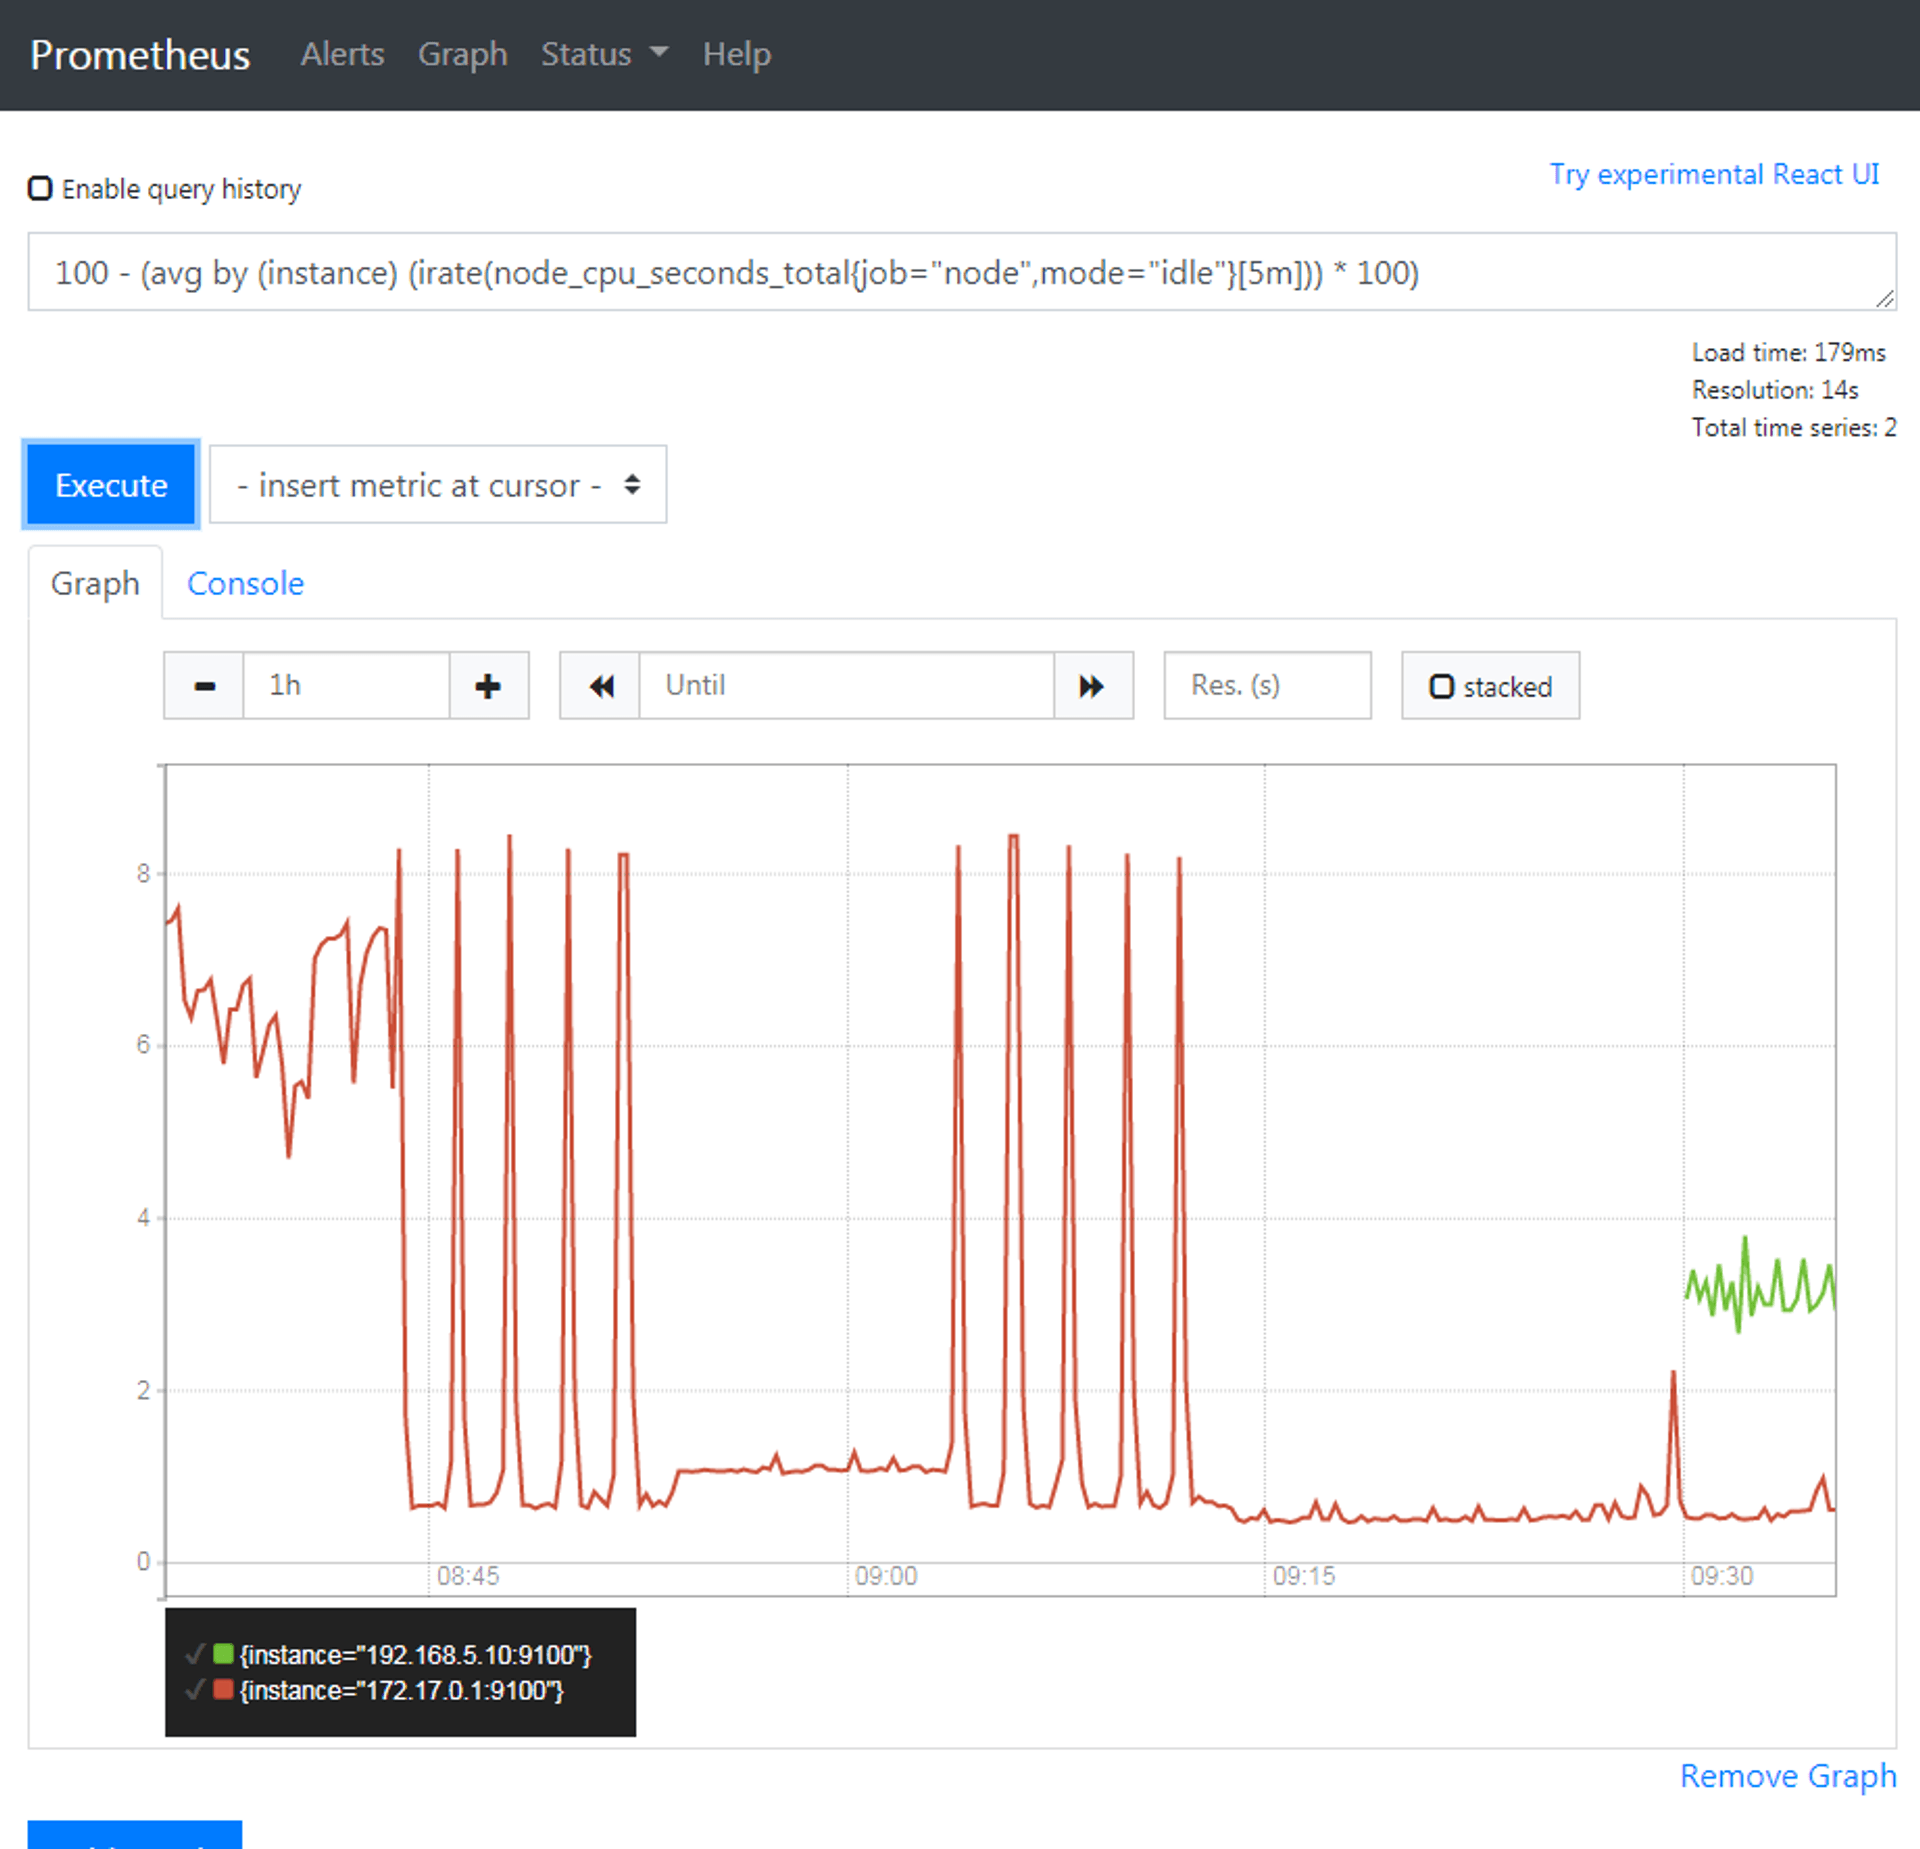
RPi 的 CPU 使用率快樂抖動中。
# 小結
上張 Prometheus 的架構圖

Prometheus 整個生態系有許多組件,在這個 Demo 中,用到的是 Prometheus Server、WebUI、Exporter 等架構圖下半部分,其他不同組件也有各自的用途。使用 Prometheus,我們能夠 Monitor 服務運行的狀況,也可以用它來通知異常(在今年的 COSCUP 中,Line 的 Speaker 就用它來觀察會議室中的活動人數,免得有人借了會議室卻不使用)。
如果你還在尋找維運工具,不妨試試看。
# Reference
標籤
其他文章
評論